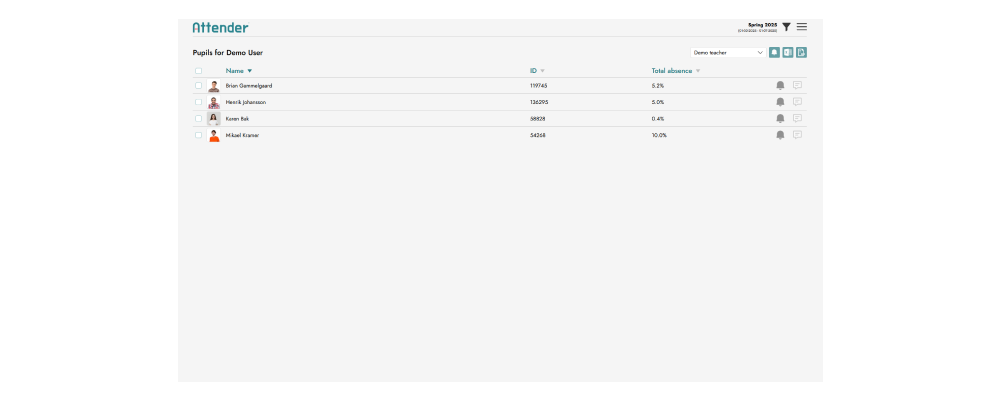
At Attender we make it easy to spot students with rising absence before it becomes a problem.
With dedicated dashboards for teachers, guidance counsellors, school leaders, school secretaries, parents and caseworkers you always see the information that is relevant for you.
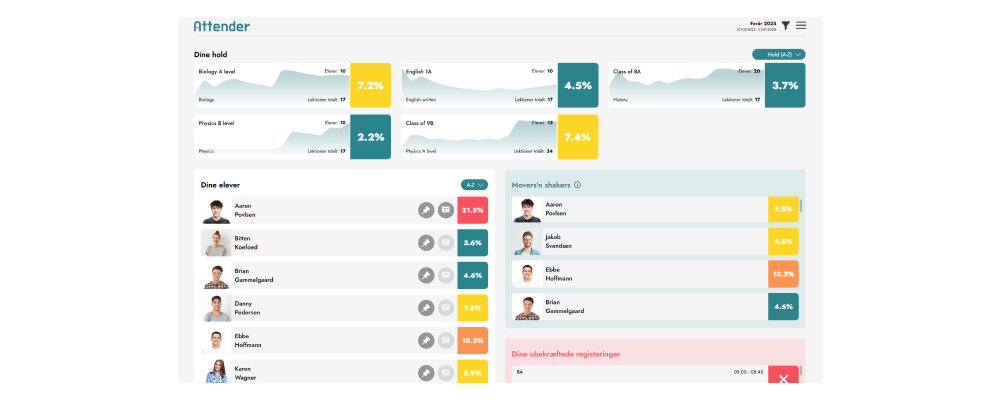
A teacher has access to attendance records for their students, lessons, and classes.
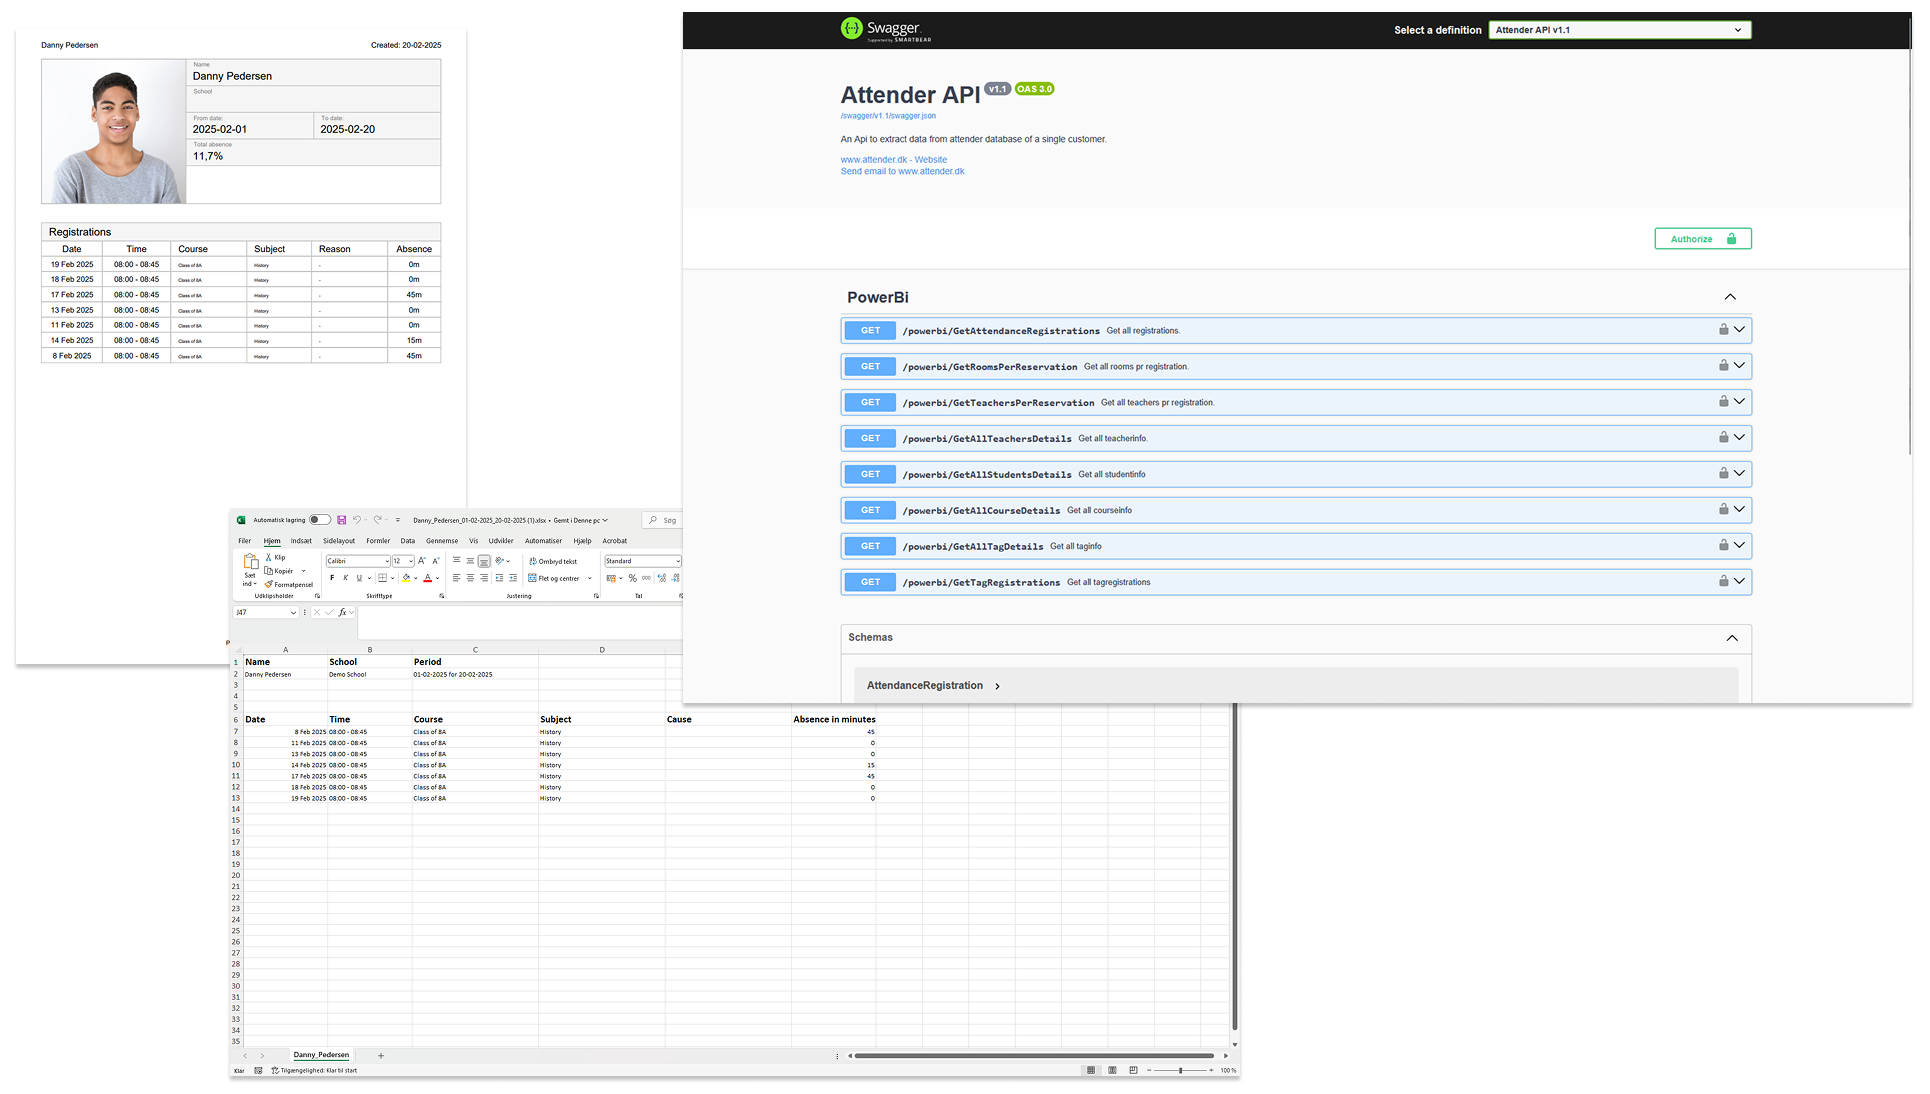
They can dive into statistics, access detailed information, and export data to PDF or Microsoft Excel. Teachers also receive live attendance statistics while taking attendance in class.
Attender also highlights students who may need extra attention.
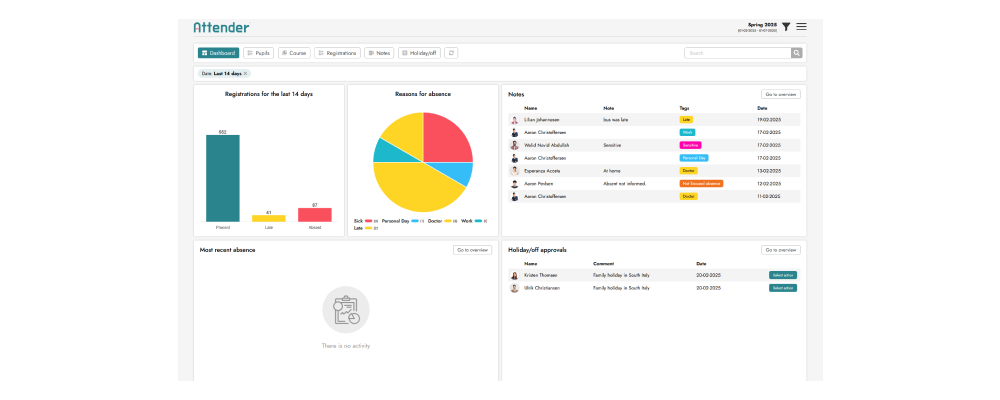
The school leader’s dashboard provides a quick overview of everything related to attendance. You can also dive into more detailed statistics.
You can make a search for students, classes, and lessons, as well as sort by attendance percentage and view absence reasons.
These dashboards include many valuable features that help you stay informed.

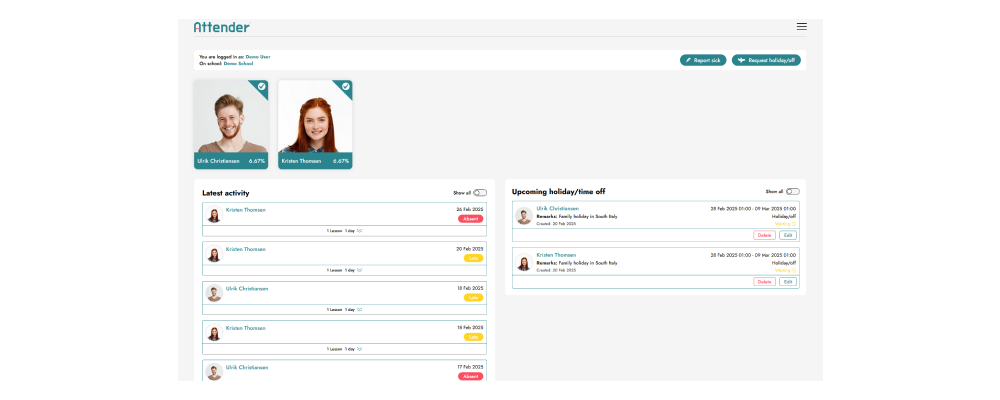
Parents naturally want to stay informed about their child’s activities. That’s why they also have access to Attender on behalf of their children.
Here, they can view their child’s attendance and also report sick leave or notify the school about vacations.
You can grant permission and access to external users, such as caseworkers, on Attender. Once access is assigned, caseworkers can track statistics for the citizens they are responsible for.
Additionally, caseworkers can export PDF and Excel reports or receive an automated monthly report. This helps both the school and the caseworker stay up to date, ensuring a seamless workflow for both parties.
If a student’s absence suddenly increases within a week, our Movers ‘N Shakers algorithm highlights this for you.
This is a valuable way to identify students whose absence rate may not yet be alarmingly high but who could be at risk.
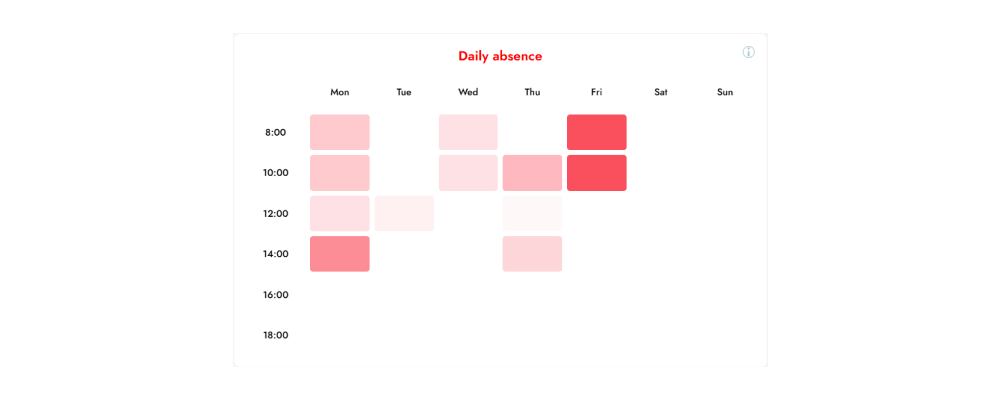
Our heatmap provides a visual representation of when a student’s absence are highest throughout the day and week.
This helps you quickly and effectively understand absence patterns. The deeper the red, the higher the absence rate.
Additionally, you can access more detailed insights — simply hover over individual time slots to view specific information for that particular slot.
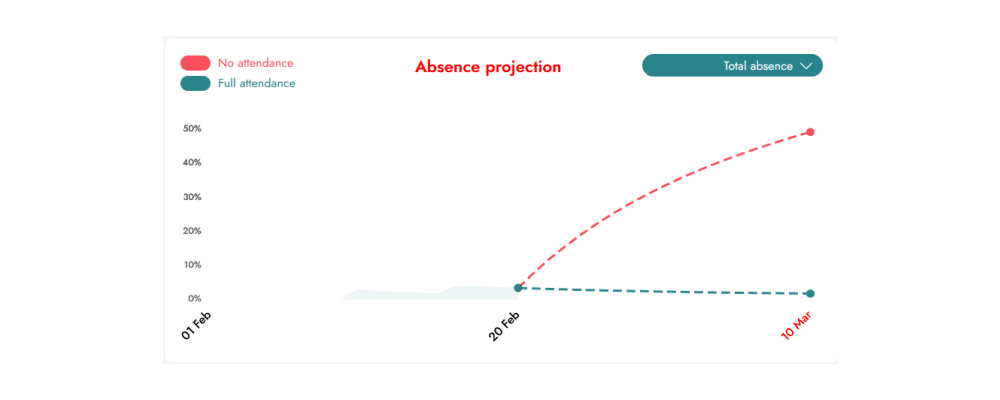
Our projected absence feature shows what a student’s future absence rate would be if they attend all or none of their upcoming lessons.
You can view a student’s projected absence across all subjects or for individual subjects.
This feature is especially useful for schools where exam requirements include a maximum absence rate or minimum attendance percentage.
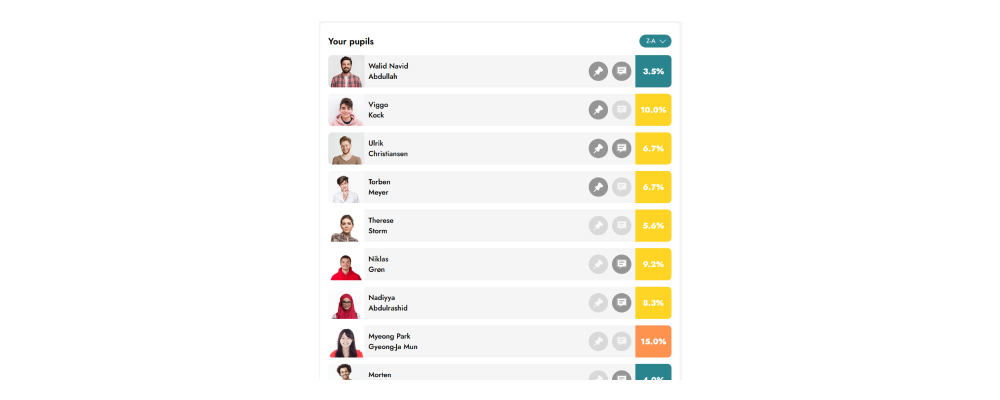
It’s incredibly easy to create an observation list for students you want to keep a closer eye on.
With this list, tracking their progress becomes much simpler, ensuring you stay informed about their development.
Exporting data from Attender via the Attender API is incredibly easy.
If you want to create custom reports in Microsoft Power BI, combine data from multiple sources, or export attendance data to an AI for deeper insights, Attender has you covered.
We already offer built-in PDF and Excel export features, but we understand that reporting needs vary. That’s why we also provide a custom reporting solution tailored to your specific requirements!
Attender has been developed in collaboration with schools
We have spent countless hours and days with schools and teachers to ensure that Attender fulfills their needs. Two things are strikingly apparent – less time should be spent on attendance registration and more time should be devoted to teaching.
Attender is a Microsoft Partner and has been developed in collaboration with Microsoft.
Follow us to stay updated!
We are delighted that you want to know more about Attender. Please fill out the form and we will reach out to you as soon as possible!


